Veni AI

Build a self-updating reporting system

Pull data from multiple sources, calculate KPIs, and send reports automatically. Make decisions faster with consistent, real-time insights.

Automated Reporting
Up to 80% Less manual reporting
Avg 35% Faster decisions
24/7 Live visibility
SCROLL
What is Automated Reporting?

Always-on reporting without manual work

Automated reporting connects data sources, calculates KPIs, and distributes insights on a schedule. Teams stop wasting hours on spreadsheets and focus on decisions.

AI ensures metrics are consistent, dashboards are up to date, and anomalies are flagged before they become issues.

Multi-source data connectors
Automated KPI calculations
Scheduled and on-demand reports
Anomaly detection and alerts
Role-based report delivery
Data governance and audit trails
Automation Background
Core Capabilities

Turn data into decisions automatically

Automation blocks for extraction, transformation, and reporting.

Data connectors

Connect CRM, marketing, finance, and product data sources in one flow.

Metric definitions

Standardize KPI formulas to keep teams aligned.

Scheduled delivery

Send weekly, monthly, or real-time reports automatically.

Anomaly detection

Spot unusual changes and notify stakeholders instantly.

Role-based distribution

Route reports to the right teams with access controls.

Governance and audits

Track data lineage and changes for compliance.

Industry Signals

The impact of automated reporting

Teams report faster decision cycles and cleaner data.

Up to 80%
Less manual work

Automation replaces spreadsheet-heavy reporting.

Avg 35%
Faster decisions

Consistent KPIs improve leadership speed.

Up to 50%
Fewer reporting errors

Validation rules reduce mistakes.

Avg 25%
Higher KPI adoption

Aligned dashboards drive usage.

Up to 40%
Faster anomaly detection

Issues are surfaced earlier.

Avg 20%
Improved forecast accuracy

Clean data powers better forecasting.

Abstract background illustrating automated reporting
Decision Intelligence

Make reporting faster, cleaner, and more reliable

AI enforces KPI consistency and reduces human error across dashboards.

Automated alerts highlight anomalies so teams can act before performance drops.

KPI consistency enforcementAutomated data quality checksReal-time anomaly alertsCross-team alignmentDashboard versioningGranular access controlAudit-ready lineageForecasting-ready datasets

Executive dashboards

Deliver leadership-ready summaries with key KPIs.

Sales performance

Track pipeline, conversion, and rep activity automatically.

Marketing ROI

Unify spend, CAC, and campaign metrics in one report.

Operations KPIs

Monitor SLAs, throughput, and fulfillment performance.

Finance close

Automate monthly close reporting and variance analysis.

Customer success

Track retention, expansion, and usage health signals.

Why Automate Reporting?

Reliable insights without the manual load

Automation turns reporting into a continuous system, not a monthly scramble.

24/7 updates

Always-current dashboards

No more outdated reports or stale spreadsheets.

Avg 35% faster

Faster decision cycles

Leadership gets consistent data on schedule.

Up to 80% less

Lower reporting overhead

Teams reclaim hours spent on manual reporting.

Up to 40% faster

Anomaly visibility

Catch KPI drops before they become problems.

Unified KPIs

Cross-team alignment

One source of truth for all stakeholders.

Compliance-ready

Audit-ready governance

Track data lineage and changes with confidence.

n8n Reporting Flow

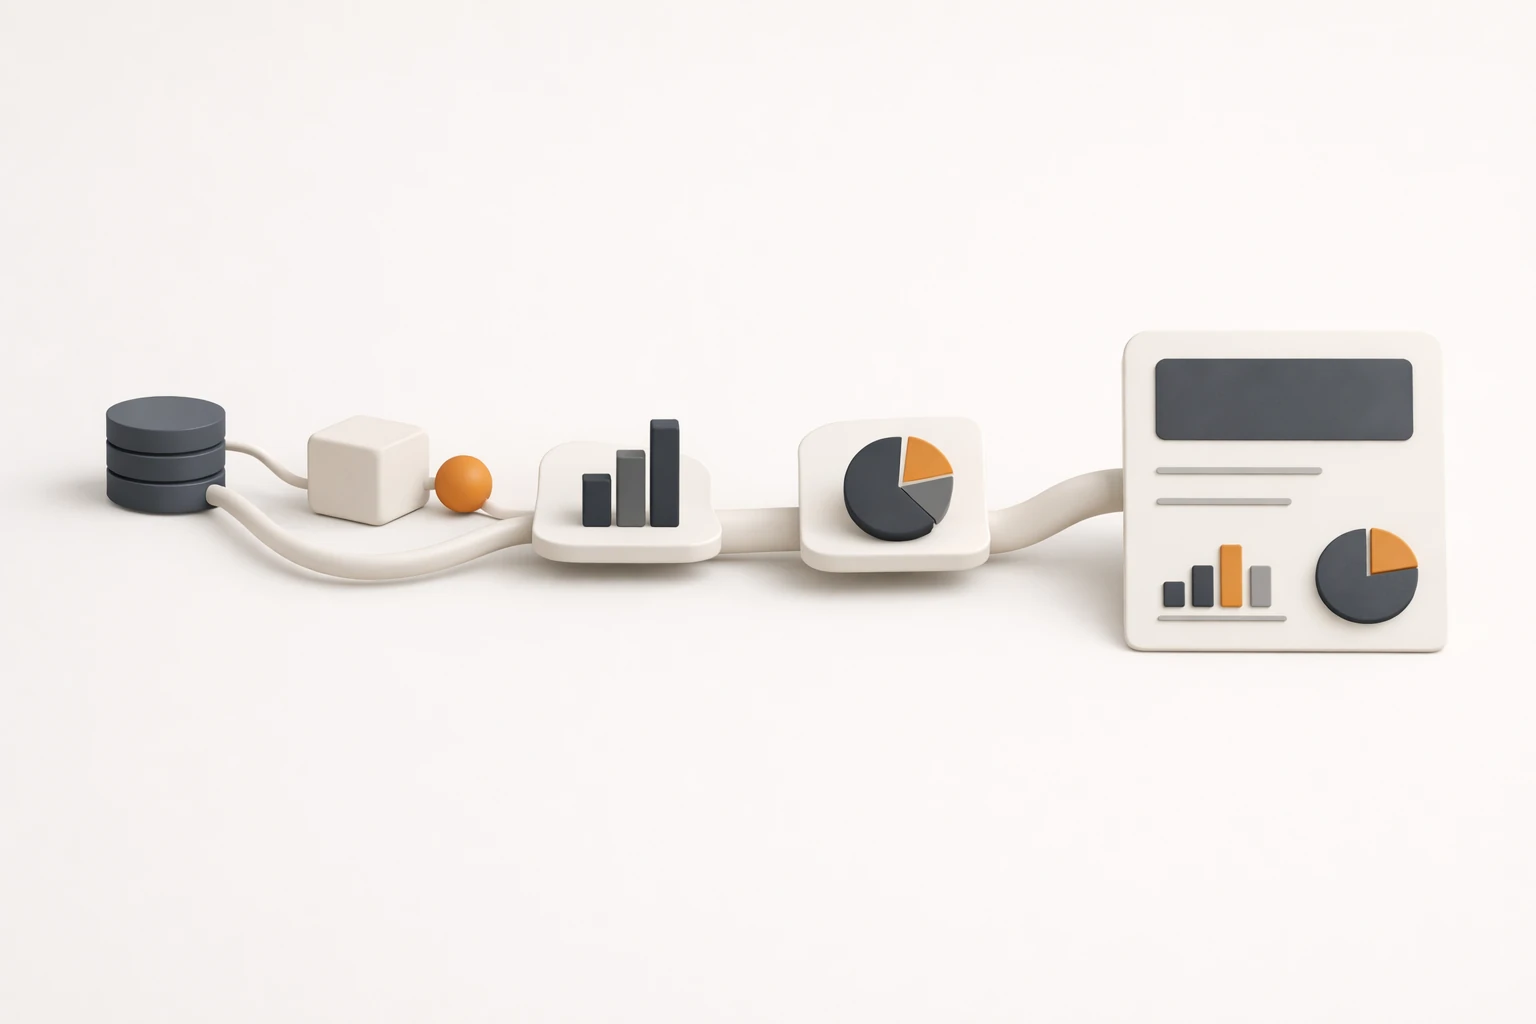
Automated reporting workflow

Link data extraction, transformations, KPI calculation, and distribution.

Data
Transform
KPI
Report
Notify

Source normalization

Clean and unify data from every system.

KPI rules

Apply consistent metric logic across teams.

Scheduled delivery

Send reports to email, Slack, or dashboards automatically.

Alerting

Notify teams when KPIs cross thresholds.

n8nLookerTableauPower BIGoogle SheetsSlackBigQuerySnowflake
Sample n8n JSONShort schema · customizable
{
"name": "Automated Reporting",
"trigger": "Scheduler: Daily",
"steps": [
{
"node": "Extract",
"action": "Pull source data"
},
{
"node": "Transform",
"action": "Clean + join"
},
{
"node": "KPI",
"action": "Calculate metrics"
},
{
"node": "Report",
"action": "Generate dashboards"
},
{
"node": "Notify",
"action": "Send alerts"
}
],
"outputs": [
"Updated dashboards",
"Scheduled reports",
"KPI alerts"
]
}
How It Works

From data source to decision-ready report

01

Connect data sources

Pull from CRM, ad platforms, finance tools, and internal databases.

02

Define KPIs

Set formulas, thresholds, and targets in one place.

03

Automate reporting

Generate dashboards and send reports on schedule.

04

Monitor and iterate

Adjust KPIs and alerts as business needs evolve.

Comparison

Manual reporting vs AI automation

Automation turns reporting into a continuous system.

Criteria
Manual Process
AI Automation
Report preparation time
2-3 days
1-2 hours
Data consistency
Inconsistent
Standardized KPIs
Error rate
Higher
Lower
Delivery
Manual sends
Scheduled delivery
Anomaly detection
Delayed
Real-time alerts
Decision speed
Slow
Faster
FAQ

Automated reporting questions

Ready to automate reporting?

Move from manual spreadsheets to real-time dashboards.